
QR Code Tracking & Analytics: Measure Your Campaign Success
Learn how to track QR code scans with analytics. Understand who's scanning, when, and where. Make data-driven marketing decisions.
QR codes are everywhere—on product packaging, billboards, business cards, and restaurant menus. But here's the question most marketers forget to ask: are people actually scanning them? Without tracking and analytics, you're essentially marketing blind. This comprehensive guide shows you how to measure QR code performance and use data to drive better results.
Static vs. Dynamic QR Codes: The Tracking Difference
Before diving into analytics, you need to understand a fundamental distinction that determines whether tracking is even possible.
Static QR Codes
Static QR codes encode data directly into the code pattern. Once generated, the content cannot be changed, and scans cannot be tracked. They're free and simple, but provide zero insight into performance.
Dynamic QR Codes
Dynamic QR codes point to a short redirect URL that you control. This enables:
- Scan tracking – Count every scan with timestamps
- URL editing – Change the destination without reprinting
- Device detection – See iOS vs. Android breakdown
- Geographic data – Track scan locations
- A/B testing – Compare different campaigns
If you want analytics, you need dynamic QR codes. TapNN's free tier includes full scan analytics.
Key Metrics to Track
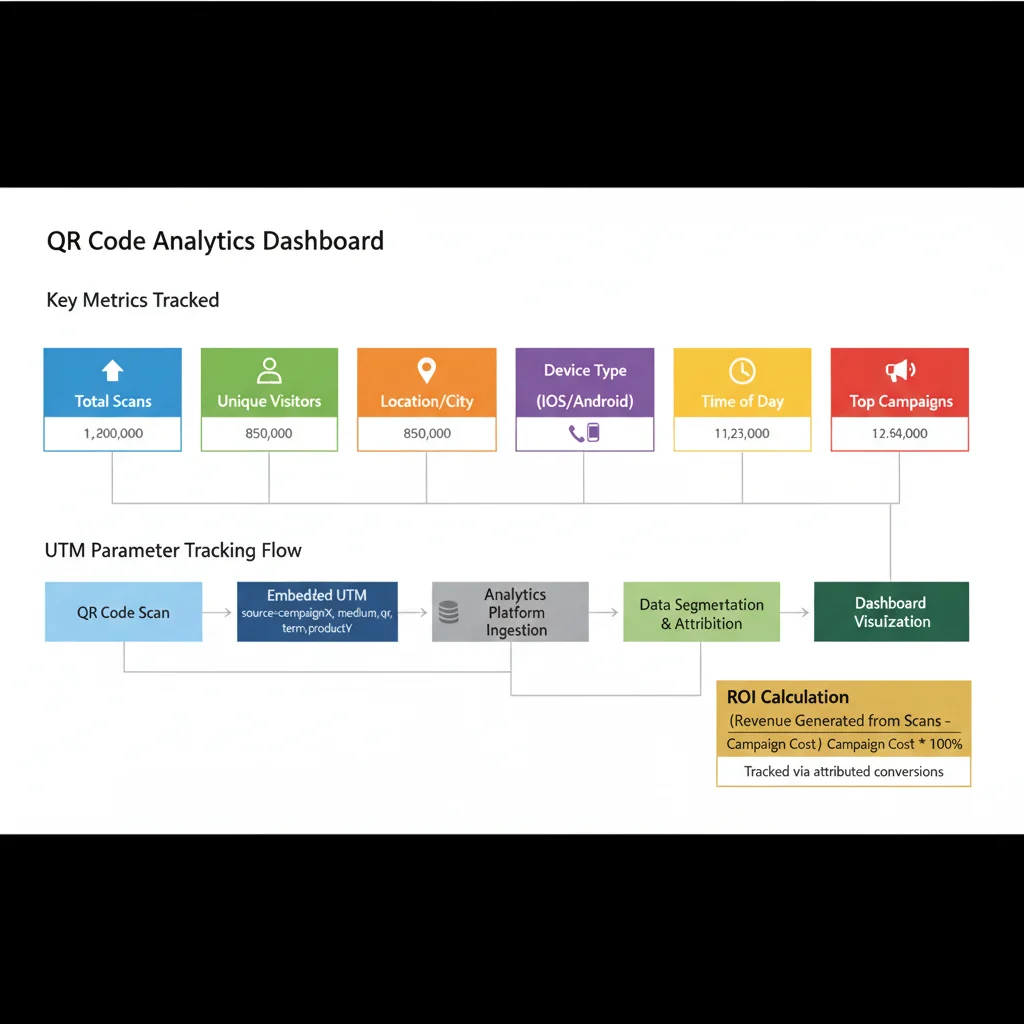
Not all metrics are equally valuable. Focus on these core data points:
1. Total Scans
The most basic metric—how many times was your QR code scanned? This includes repeat scans from the same user. Useful for measuring overall exposure and reach.
2. Unique Scans
More valuable than total scans, unique scans count individual users (typically by device fingerprint or IP). This tells you how many actual people engaged with your code.
3. Scan Time and Patterns
When are people scanning? Look for:
- Peak hours – Morning commute? Lunch break? Evening?
- Day of week – Weekdays vs. weekends
- Seasonal trends – Holiday spikes or summer lulls
This data helps you time campaigns and understand user behavior.
4. Geographic Location
Where are scans coming from? City-level or country-level data reveals:
- Which markets respond best
- Whether local campaigns reach their target area
- Unexpected geographic interest (potential new markets)
5. Device and OS Breakdown
Understanding your audience's devices helps optimize landing pages:
- iOS vs. Android – Different demographics and behaviors
- Mobile vs. tablet – Screen size implications
- Operating system version – Technical compatibility
6. Scan-to-Conversion Rate
The ultimate metric: of everyone who scanned, how many completed your goal (purchase, signup, download)? This requires connecting QR analytics to your website analytics or CRM.
Setting Up UTM Parameters
UTM (Urchin Tracking Module) parameters are tags added to URLs that allow Google Analytics to track campaign performance. They're essential for serious QR tracking.
The Five UTM Parameters
- utm_source – Where the traffic comes from (e.g., "qr_code")
- utm_medium – Marketing medium (e.g., "print", "packaging")
- utm_campaign – Specific campaign name (e.g., "summer_sale_2024")
- utm_term – (Optional) Keywords for paid search
- utm_content – (Optional) Differentiate similar content
Example UTM-Tagged URL
Original URL:
https://example.com/landing-page
With UTM parameters:
https://example.com/landing-page?utm_source=qr_code&utm_medium=print&utm_campaign=summer_flyer
UTM Best Practices for QR Codes
- Use consistent naming conventions across campaigns
- Keep parameters lowercase (they're case-sensitive)
- Avoid spaces—use underscores or hyphens
- Create a tracking spreadsheet to document all UTM combinations
- Use Google's Campaign URL Builder for error-free tagging
Integrating with Google Analytics
Once you've added UTM parameters, Google Analytics automatically captures the data. Here's how to view it:
Google Analytics 4 (GA4)
- Navigate to Reports → Acquisition → Traffic Acquisition
- Click "Add comparison" and filter by Session source = "qr_code"
- Or go to Reports → Acquisition → User Acquisition for first-touch attribution
Custom Reports for QR Campaigns
Create dedicated reports to track:
- Sessions from QR codes over time
- Conversion rates by QR campaign
- Bounce rates compared to other traffic sources
- Average session duration from QR visitors
Advanced Tracking Techniques
A/B Testing QR Campaigns
Test different variables to optimize performance:
- Placement – Same QR code in different locations
- Design – Colored vs. black/white QR codes
- CTA – "Scan for discount" vs. "Learn more"
- Size – Larger vs. smaller codes
Create separate dynamic QR codes for each variant and compare scan rates.
Multi-Location Tracking
For businesses with multiple locations (franchises, retail chains), create unique QR codes per location:
- Use utm_content to tag location (e.g., "store_123")
- Or create separate dynamic codes for each
- Compare performance across locations in your dashboard
Offline-to-Online Attribution
QR codes bridge the physical-digital gap. Track this journey by:
- Using unique codes per print run or batch
- Tagging codes by distribution channel (in-store, mailer, event)
- Correlating scan spikes with offline campaign timing
Measuring ROI
The ultimate question: is your QR code campaign profitable?
ROI Formula
ROI = (Revenue from QR Campaign - Campaign Cost) / Campaign Cost × 100
Tracking Revenue Attribution
Connect scans to revenue by:
- Setting up e-commerce tracking in Google Analytics
- Using unique promo codes per QR campaign
- Implementing conversion pixels on thank-you pages
- Tracking coupon redemptions tied to QR sources
Beyond Direct Revenue
Not all value is immediate sales. Consider:
- Lead generation – Cost per lead from QR campaigns
- Brand awareness – Reach and impressions
- Customer engagement – Time spent, pages viewed
- App downloads – Installation tracking
Common Tracking Mistakes to Avoid
1. Using Static QR Codes
The number one mistake. Static codes can't be tracked at all. Always use dynamic codes for marketing campaigns.
2. Forgetting UTM Parameters
Without UTM tags, QR traffic appears as "direct" in analytics, making it impossible to attribute correctly.
3. Inconsistent Naming
"qr_code", "QR-Code", and "qrcode" create three separate sources in analytics. Standardize your conventions.
4. Not Setting Goals
Scans mean nothing without context. Define what success looks like before launching.
5. Ignoring the Data
Collecting data is pointless if you don't act on it. Schedule regular reviews and optimize based on insights.
TapNN Analytics Dashboard
TapNN's built-in analytics provide everything you need:
- Real-time scan counter – See scans as they happen
- Geographic heatmap – Visualize scan locations
- Time-series charts – Track trends over days, weeks, months
- Device breakdown – iOS vs. Android pie charts
- Export options – Download CSV reports
- Campaign comparison – Side-by-side code performance
All analytics are available on the free plan with no scan limits.
Creating a Tracking Strategy
Before Launch
- Define KPIs (scans, conversions, revenue)
- Set up UTM conventions
- Create tracking spreadsheet
- Configure Google Analytics goals
- Test QR code functionality
During Campaign
- Monitor daily scan rates
- Watch for anomalies (sudden drops or spikes)
- Track conversion funnel
- Note external factors (weather, events, news)
After Campaign
- Calculate total scans and unique users
- Determine conversion rate
- Calculate ROI
- Document lessons learned
- Plan optimization for next campaign
Industry Benchmarks
What's a "good" scan rate? It depends heavily on context, but here are rough benchmarks:
| Placement Type | Expected Scan Rate |
|---|---|
| Product packaging | 1-3% of customers |
| Restaurant table tents | 15-30% of diners |
| Event materials | 20-40% of attendees |
| Billboard/outdoor | 0.1-0.5% of passersby |
| Direct mail | 2-5% of recipients |
Don't compare billboard performance to restaurant menus—context matters.
Get Started with Tracking
Data-driven marketing isn't optional anymore—it's how successful campaigns are built. QR code analytics give you visibility into the offline world that was previously impossible to measure.
Start tracking your QR campaigns today:
- Create a free dynamic QR code with built-in analytics
- Add UTM parameters to your destination URL
- Deploy your code and monitor the dashboard
- Review data weekly and optimize
Every scan tells a story. Make sure you're listening.
Create Your QR Code Now
Free, fast, and no signup required. Start creating professional QR codes today.
Free QR Code Generator